Describe the dashboard. Get a live app.
Somebody on your team has a dashboard in their head and a ticket sitting in the BI queue. With Data Apps they say who it’s for and what it should show. Databasin checks the data, agrees a plan with them and builds it: the headline, the numbers that matter, the charts, the filters. Then they change it by asking.
Everyone who opens the link sees today’s numbers, limited to what their own access allows.
$50 credit · No card · Your first app the same afternoon
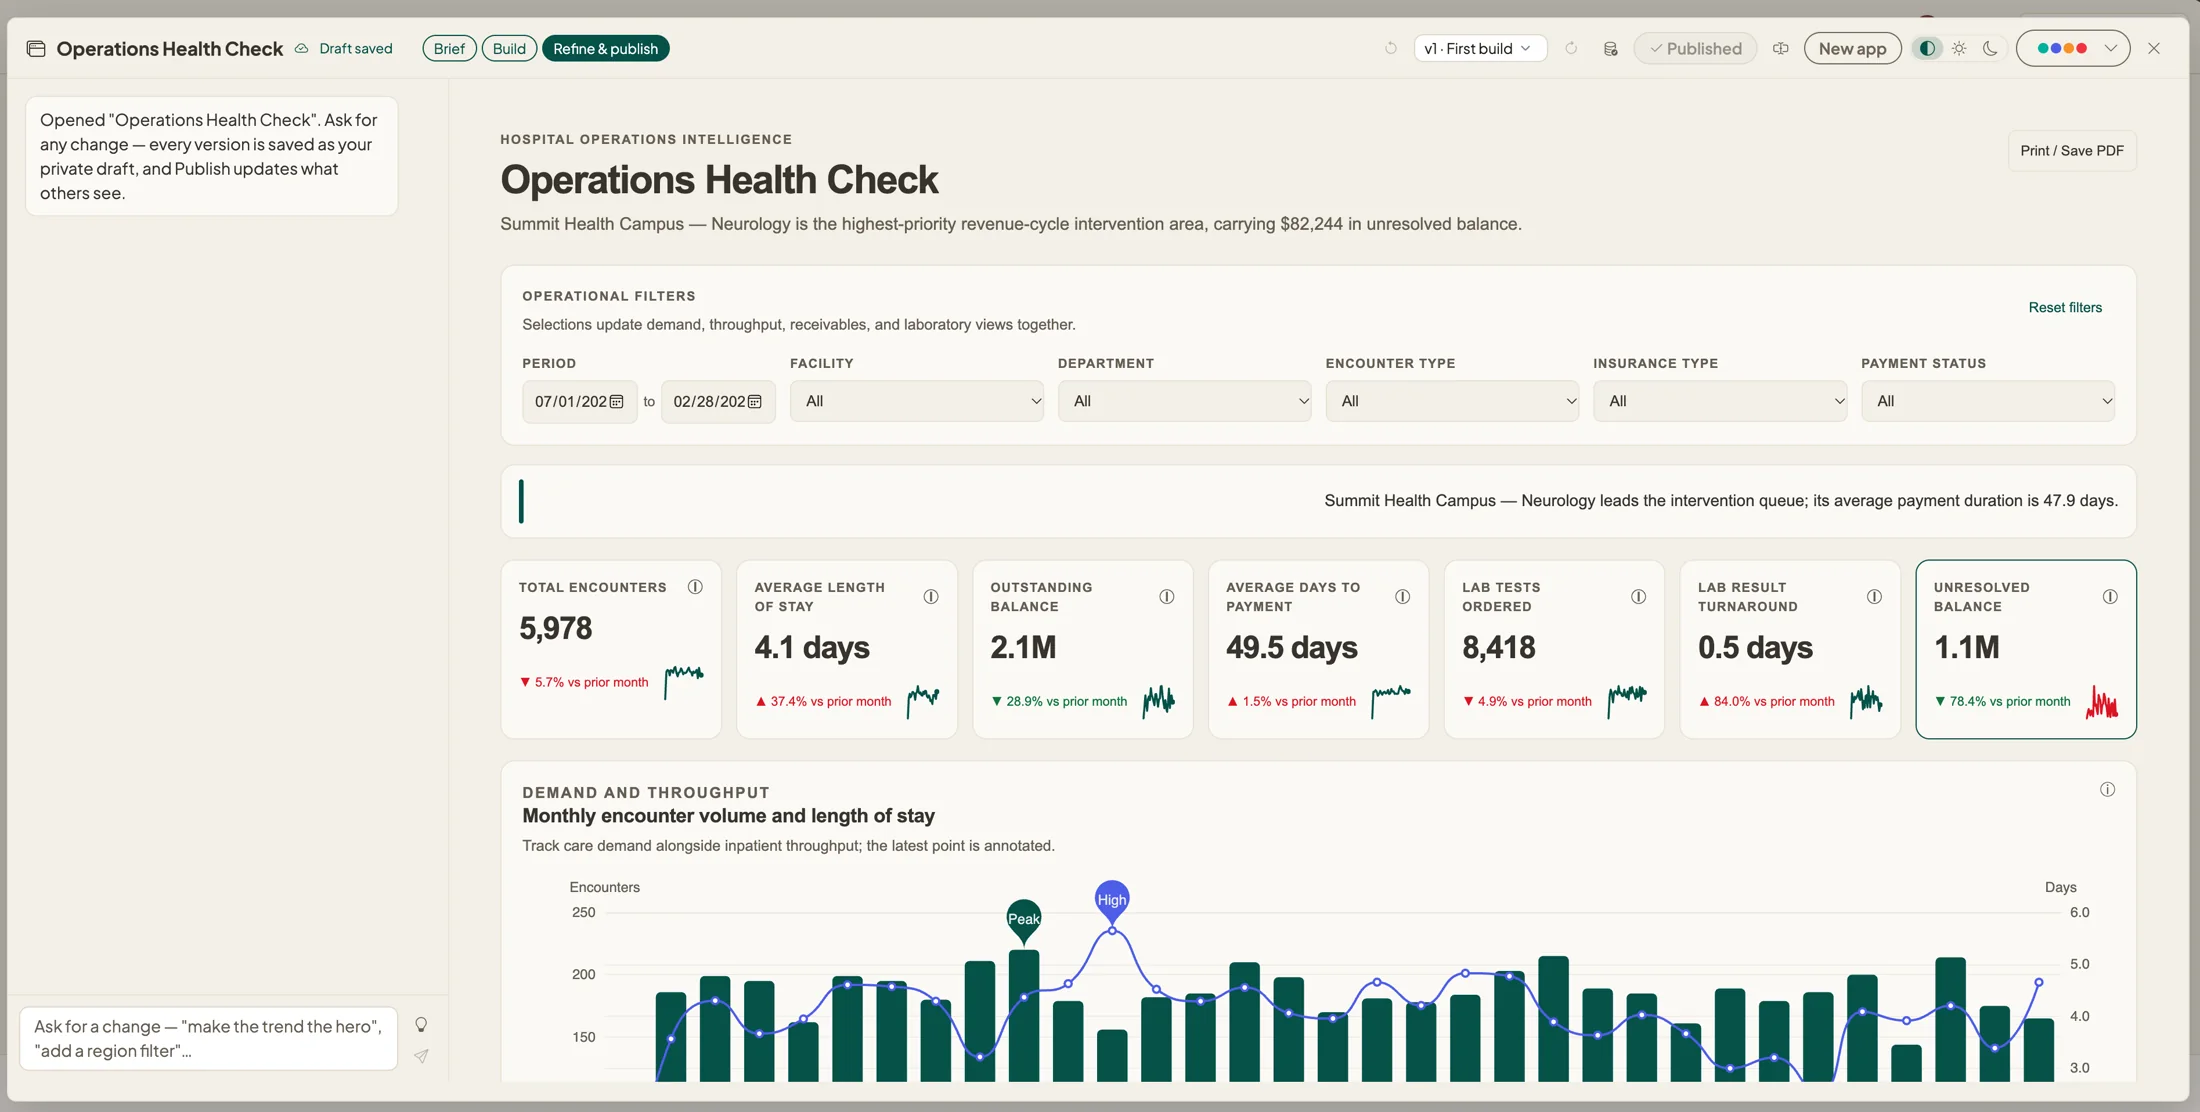
It checks your data before it builds anything.
Most of what goes wrong with a dashboard goes wrong before anyone draws a chart: the wrong table, a total counted twice, a running balance added up across days. Data Apps looks for those problems first. We built it to plan before it builds because we’ve seen too many first drafts go out with a number nobody could explain.
- You describe itWho it’s for, what it should show, the time range. A few questions back and forth, no forms.
- It checks your dataIt explores your tables and writes the brief: each metric and how it’s defined, the filters, the sections, the queries. Every query runs before anything is built.
- It buildsAs soon as the plan holds up, the first version builds on its own. It only stops when it needs your answer.
- You change it by asking“Remove the length-of-stay card.” “Split the sections into tabs.” It changes only what you asked, and checks the page before you see it.
Started in Databasin One? Choose Make Data App under any answer and the app starts from the questions you already asked.
Bring the Power BI report you already have. beta
Upload a Power BI report or a React dashboard, the kind an AI assistant writes. Data Apps lays it out like the original, on your Databasin tables, translates the calculations, and gives you a plain list of anything that couldn’t carry over. Tableau is next.
For a lot of teams this is the way off per-seat BI licenses: keep the layout people know and the definitions finance agreed to, and share it as a link. Some Power BI visuals and calculations don’t translate cleanly yet. That’s why it’s labeled beta, and why it always lists what it left out.
How Data Apps compare with an AI chat or a BI tool
An AI chat can write a beautiful page in minutes, but the numbers are pasted in and nobody governs who sees them. BI tools are live and governed, and every page is built one tile at a time. Data Apps has the good half of each.
| AI chat dashboard | Traditional BI | Data Apps | |
|---|---|---|---|
| Designed as one page that tells a story | Yes | Tile by tile | Yes |
| Live data, fresh on every view | Pasted values | Yes | Yes |
| Each viewer sees only what they’re allowed to | No | Yes | Yes |
| Built and changed by asking | Yes | No | Yes |
| Shared, versioned, republished in place | No | Yes | Yes |
| Data stays in your warehouse | No | Varies | Yes |
Try a ready-made app on sample data first.
The Data Apps home lists your apps, the ones shared with you, and a marketplace of ready-made ones. Preview any connector app on sample data first. When it looks right, Get this app connects the source, starts the sync and builds the app the moment the data lands. No SQL and no setup somewhere else.
Ready-made today: HubSpot Pipeline Health, Sales Team Performance (HubSpot joined to Rippling), Table Profiler, Lakehouse Pulse and Exchange Scorecard, plus Dashboard, which builds anything you describe.
Ready-made connector apps run on Trino lakehouses for now.
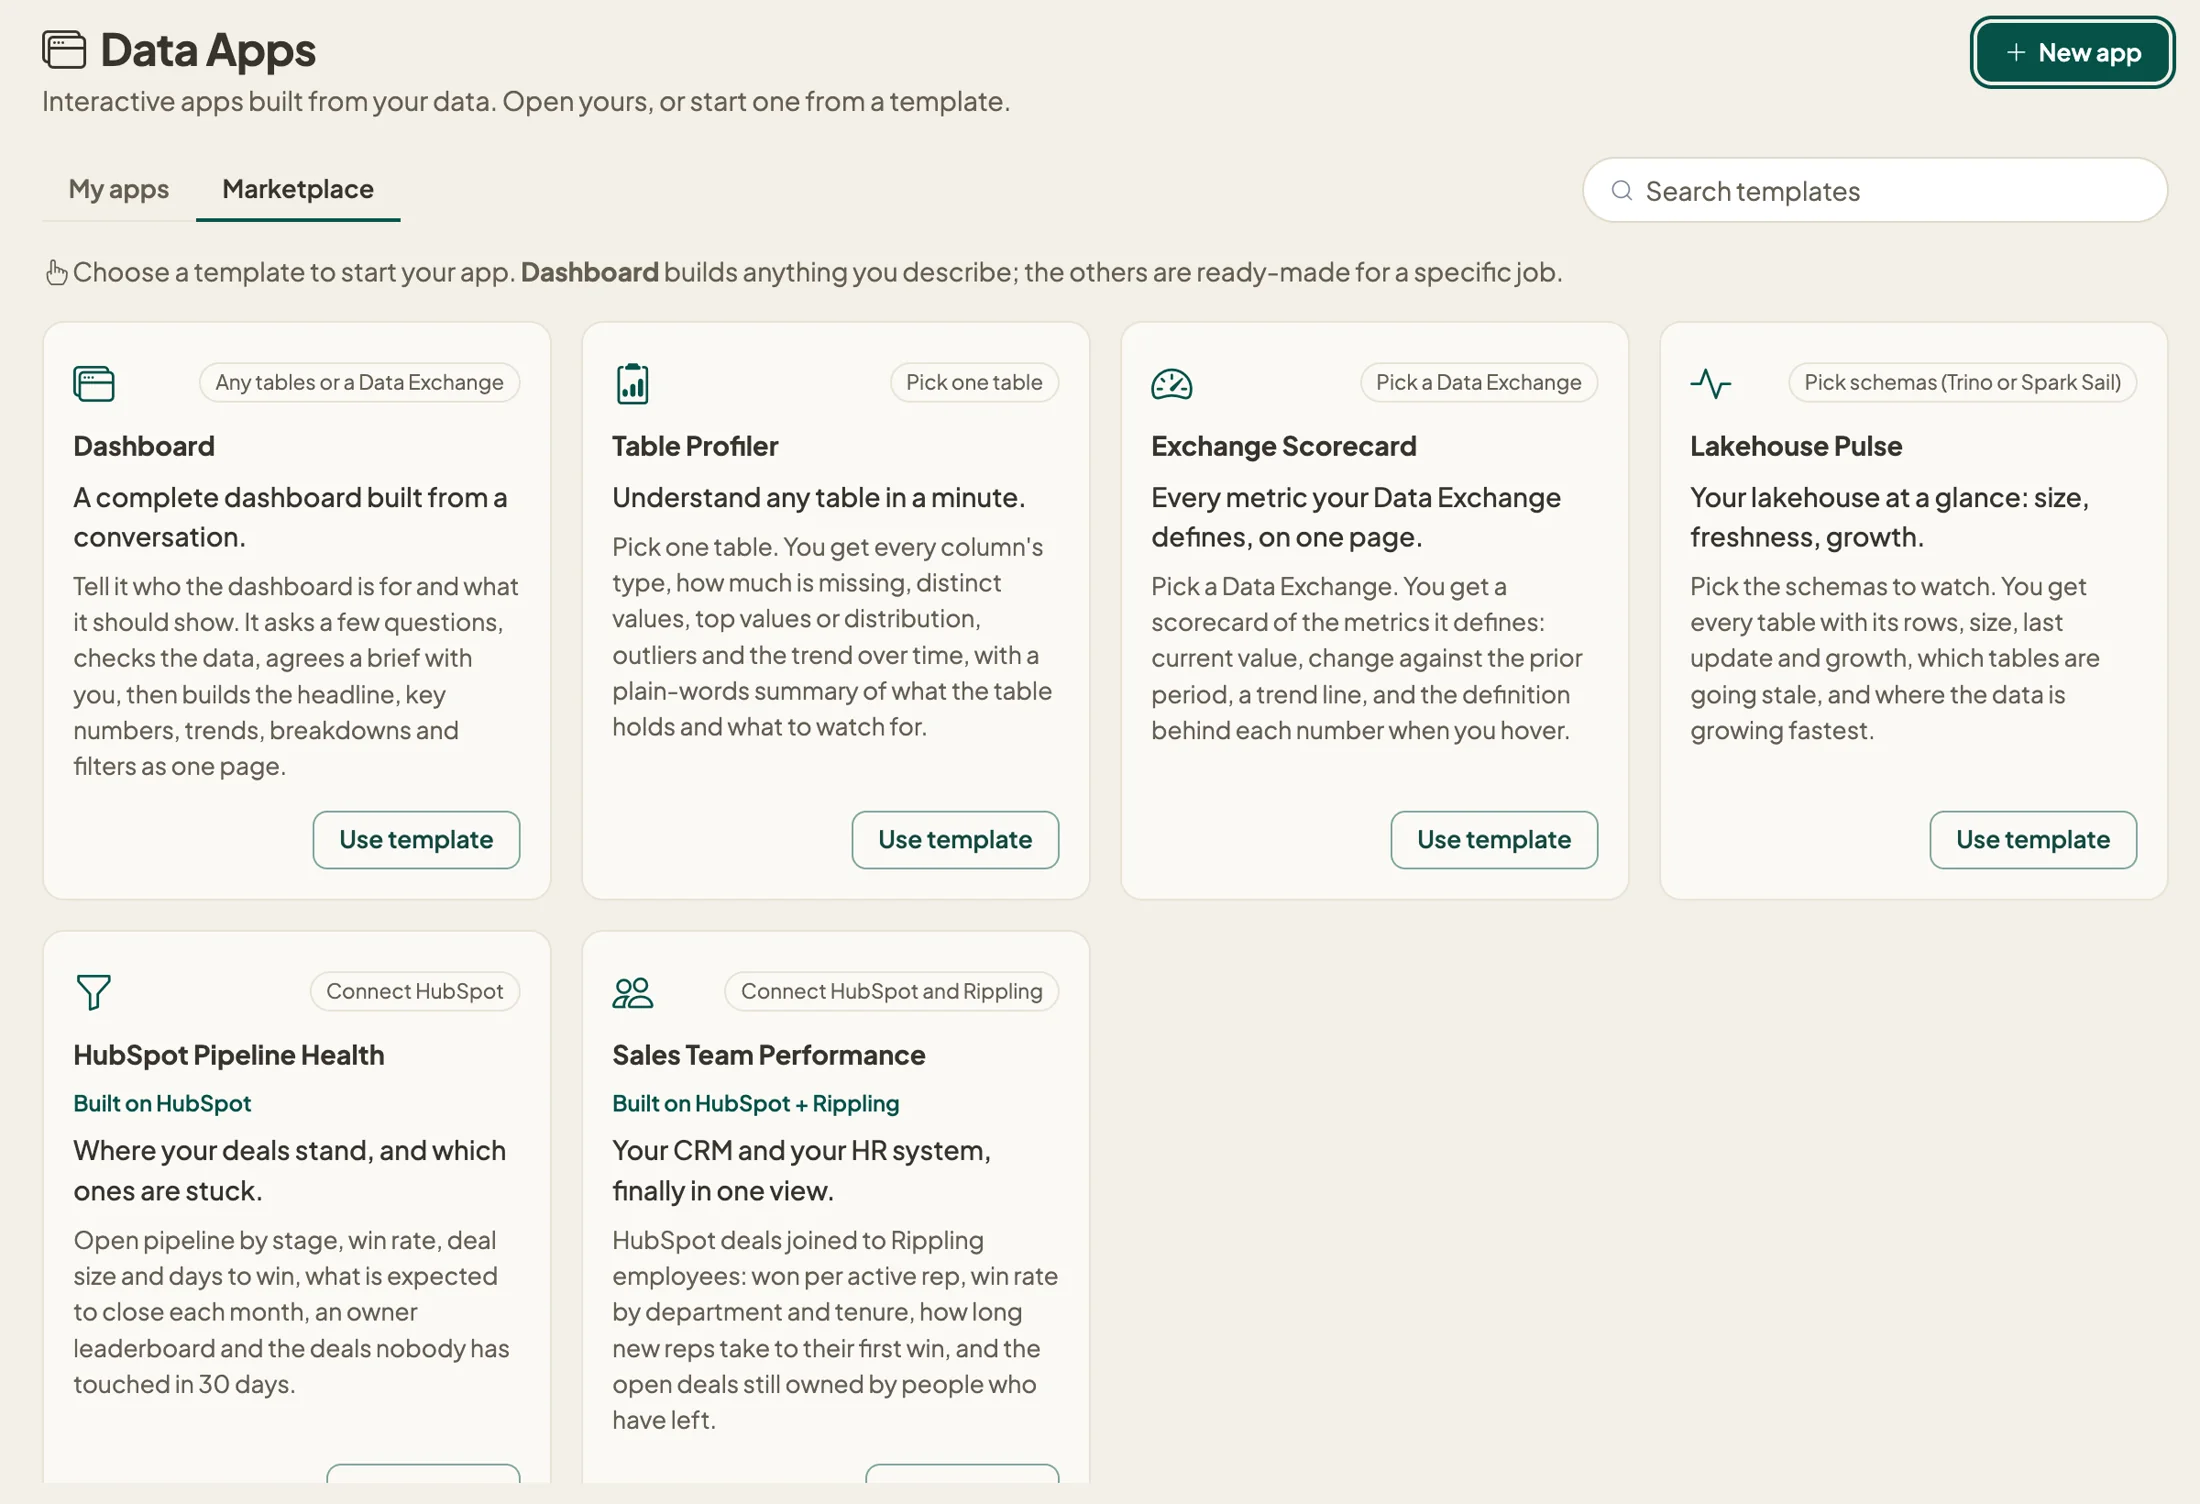 The marketplace. Pick one, or start from Dashboard and describe your own.
Apps store the page and its queries. Your data stays in your lakehouse.
Every person who opens an app runs its queries with their own warehouse access and sees the latest numbers. No data is copied into the app. We designed it that way so your security team has one less copy of the data to keep track of.
Filters re-run the queries in the warehouse, so totals, trends and cards all change together, not just the rows on screen. Up to 2,500 rows per query.
Apps follow the metric definitions in your Data Exchanges, so “active customer” means what you say it means. Every query is re-checked as read-only each time it runs.
Each app runs sealed off from the rest of Databasin and from the internet: no credentials, no outbound calls. It refuses to publish a page with numbers typed into it.
Works on your Databasin lakehouse (Trino and Databasin Sail) and on Databricks, and wakes a sleeping cluster when it needs to. Pick which AI model builds it from the ones connected to your project.
Start with the dashboard your team waits on most.
$50 credit · No card · Bring a .pbix if you have one